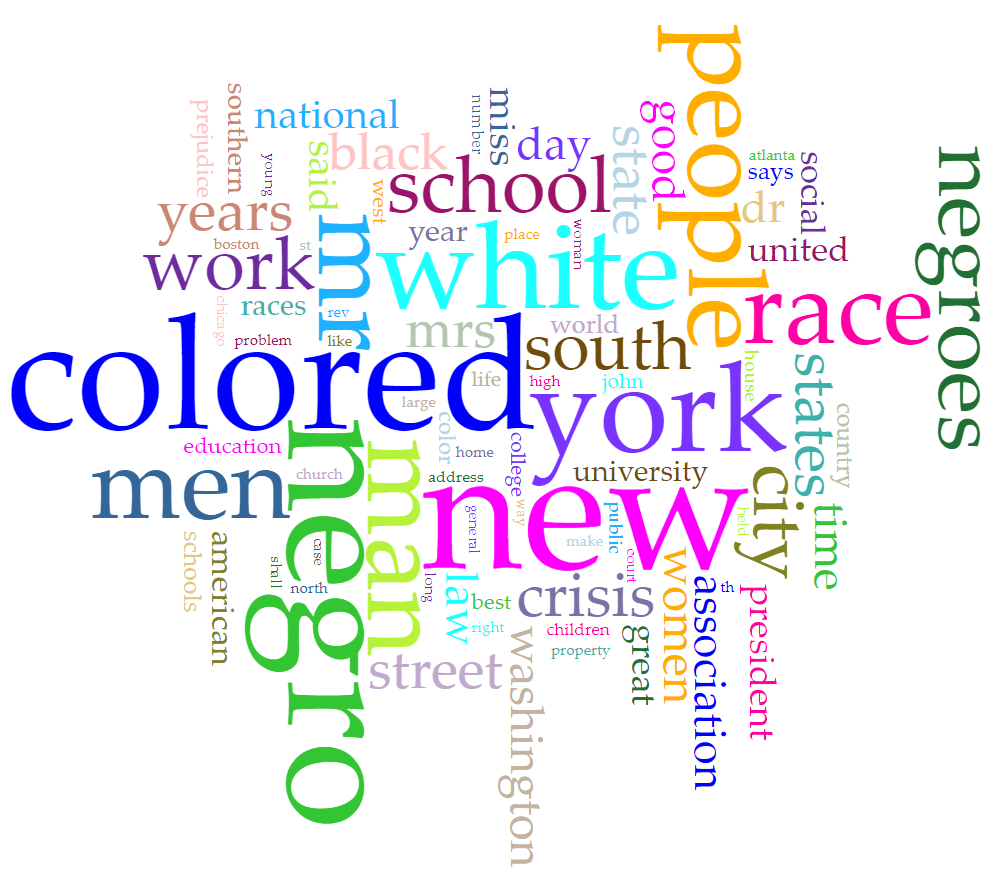
Main Topic: Text Data Analysis Visualization Practices for The Crisis Magazine with Voyant
Focus Aspect: Collect text data from The Crisis and visualize them with tools in a form of a chart or graph.
Main Idea:
- The impact of virtual space technology created by a person named digital humanities played a role in improving the technology of data collection and summary visualization, which laid the foundation for the activity of data visualization belonging to Journalism and other text related studies. So what I’d like to know is how transformation with Voyant is done to simplify the data collected from words to follow up the trends and mobilize it.
Research Questions:
- What data transformations are applied in order to investigate text data with data visualization?
Visualization of the process:
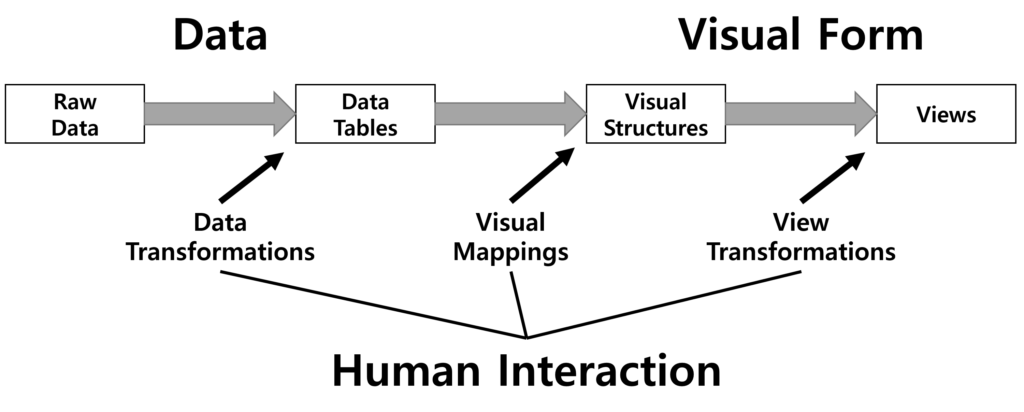
- After research on written words, develop various raw data.
- Clean up the data in tables.
- Choose visual structure types.
- Prepare data which transformed while collecting and analyzing.
- Create a visual chart or graph.
Analyzing results:
The analysis is performed using systematic methods to find trends, grouping, or other relationships between different data types. Data Visualization is the process of putting data into charts, graphs, or other visual formats to inform analysis and interpretation. In conclusion, the letters from The Crisis magazine are organized into classifications such as data visualizations, and the themes are distributed as a trend to suit the times, and the work continues to our generation. If these technologies are further studied and developed, I am sure that the information and communication technologies and technologies related to emergency relief signal communication will also be developed to help enrich people’s lives.
This is awsome. Your post is clear and very detailed. I can see the process of data analyze and the application of the data analyze.
I enjoyed reading your blog post and how you used two different figures to convey your message. Your research question on what data transformations are used to analyze text data with visualization is straightforward in using the different tools Voyant has to offer. Also from what I gathered, it is important that we also know that with the help of DH, what we have available through different visualization processes can help not only succeed in data processing but for the future of life as well.